What was the challenge?
Their intuitive AI ECG monitoring platform (PACE), shares data via bluetooth directly from the ECG device to the patient’s smartphone. PACE replaces the need for patients to wear bulky and expensive ECG monitors for up to a week before returning the device to a clinician, who analyses the bulk data before drawing conclusions. Understandably this process takes up valuable clinician time.

GCD were challenged to develop a proof of concept that explored and resolved how best to visualise ECG data and detected arrhythmias from long term heart recordings using PulseAI’s AI ECG algorithms and wearable patch based monitor.

The Solution
On launch of the proof of concept project, we held an initial virtual kick-off meeting to discuss with PulseAI the key requirements and ideas around the project. Our team was given access to raw data traces and post AI data traces, so we could understand the data – visualising this initially through simple tools like excel. Using the project management MoSCoW method we set deliverables that enabled our team to focus on the key outcomes of the project
The team analysed PACE and how vast amounts of data (approximately 360 readings per second) is streamed to the Cloud where it is processed to automatically detect arrhythmias – it was clear that the challenge lay in surfacing this information and potential issues in a clear and informative way.

With a clear understanding of the requirements, our team entered into a two week agile sprint with a team of two developers and a designer. The client was involved in daily virtual standups reviewing progress, providing feedback and helping adjust plans to make the best use of the remaining budget.
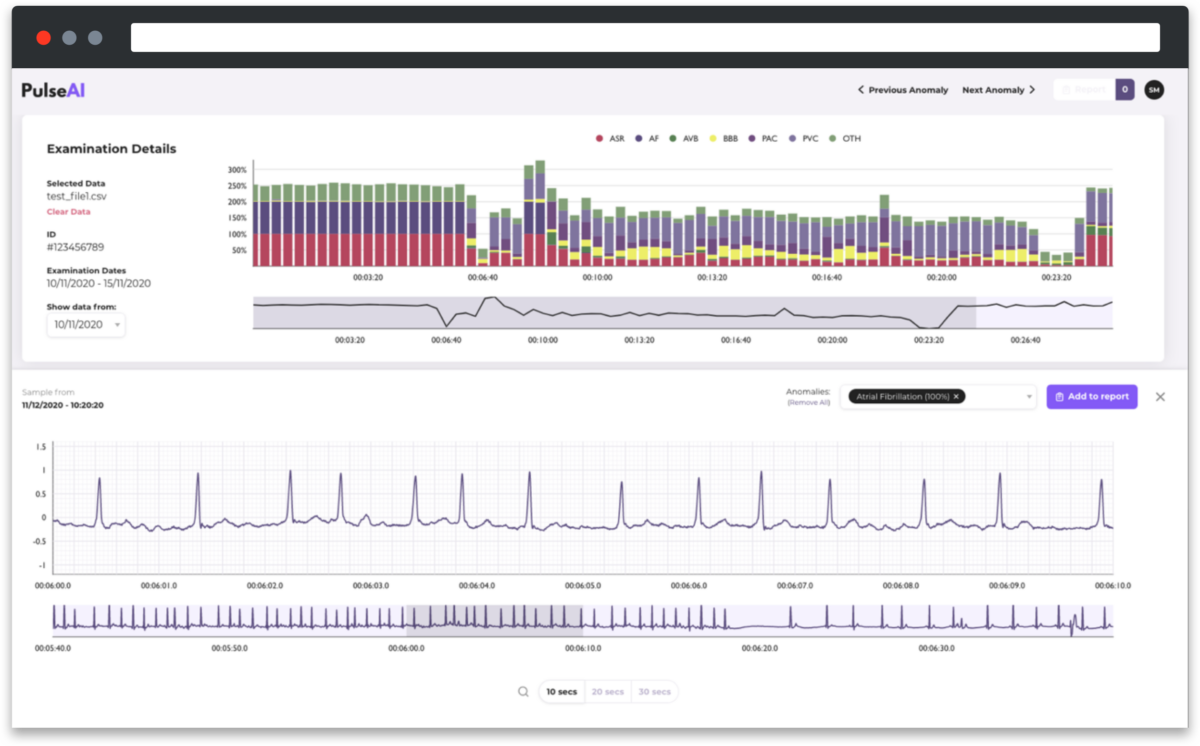
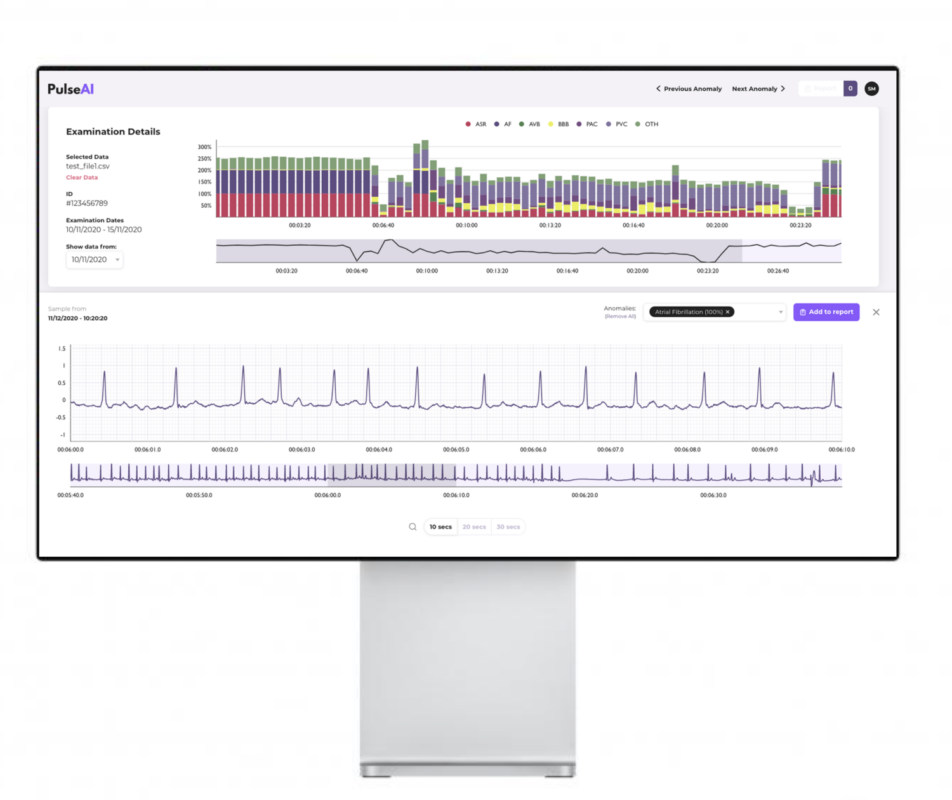
As a result, the team developed a prototype that was able to assimilate all of the data and present it back to the clinician in a visual report containing all of the relevant trace graphs and highlight any defects detected on that trace.

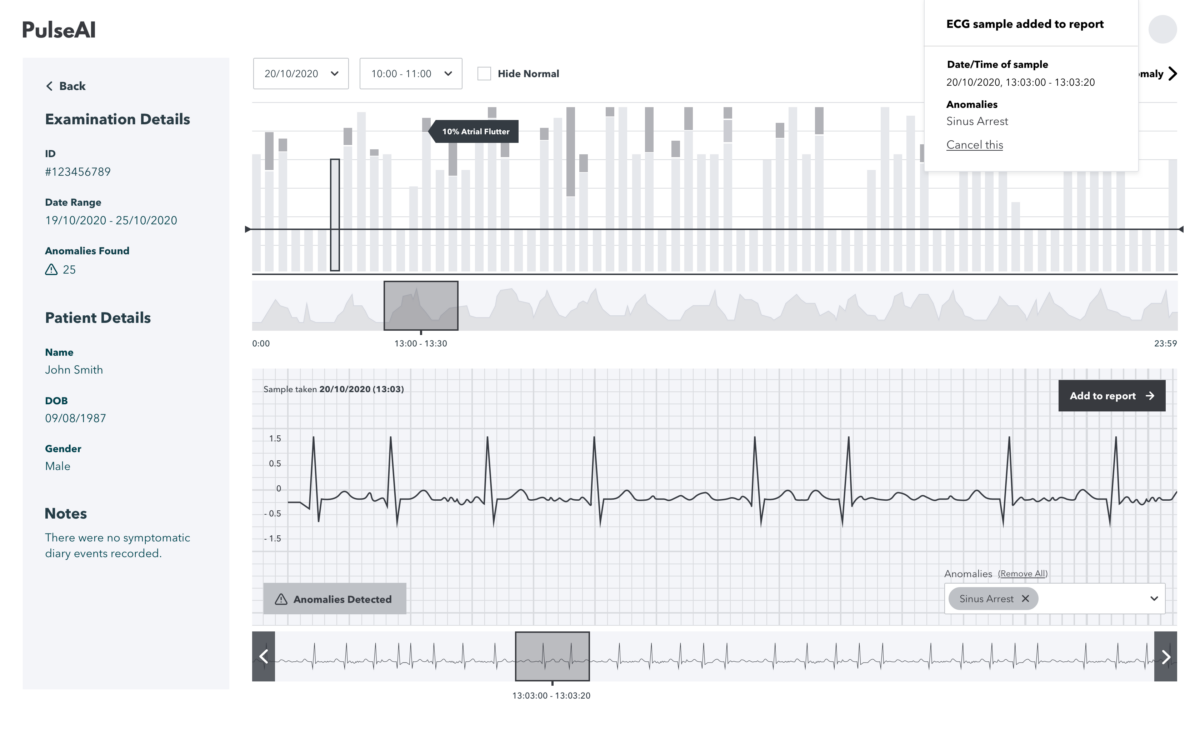
UX Wireframes produced allowed the team to rapidly work through the ideation stage early in the sprint.
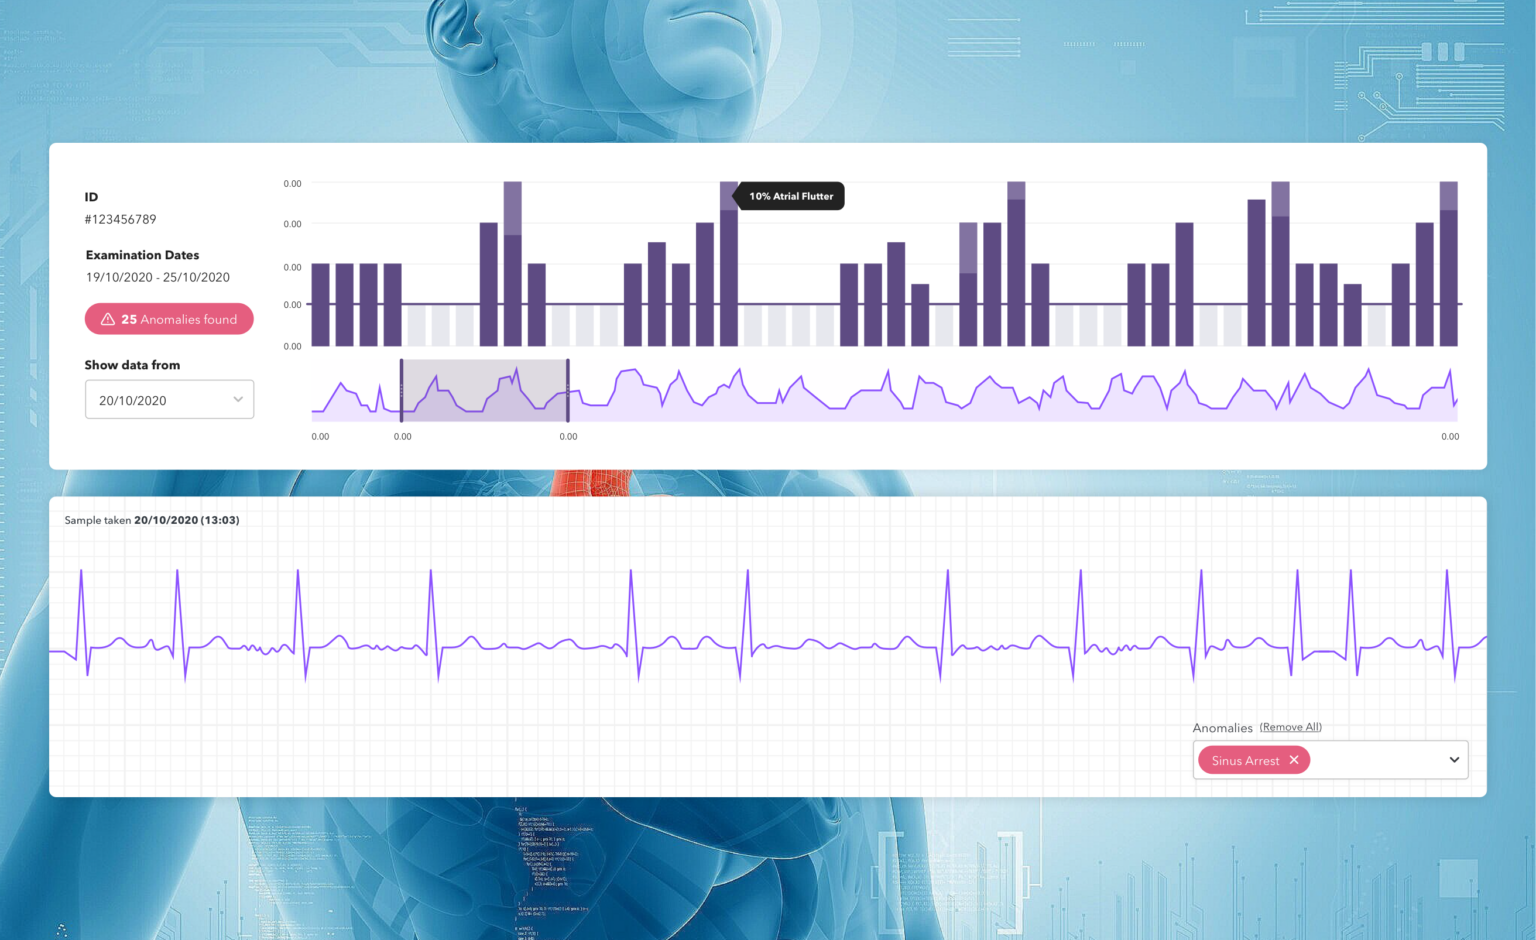
The data is visually presented in two graphs, the first is an overview bar chart which breaks the entire trace into 20 second slices clearly showing those slices most affected. The second is a deeper dive into trace graphs related to the particular slice from the bar chart.
In addition, the team built the functionality of being able to scroll along a trace to see before and after defect segments, the ability to add a new defect that the AI didn’t detect but can be visually seen, and the ability to remove a defect artificially detected by the AI were all identified as key features for the proof of concept.
The Results
The outcome of the proof of concept project was a functioning prototype – a lightweight web app built in React which is run directly from S3, meaning the solution is completely serverless and therefore cost effective for the client to use as a demo while pursuing additional funding to progress the project.
The web app meets the initial deliverables and excitingly is the core building block for future development for the PulseAI AI ECG monitoring platform.
What does the proof of concept app do?
The new interface improves the diagnostic process by surfacing data for the clinician in a format that is relevant and easy to consume. It allows the information to be assessed quicker, facilitating more informed decision making for the clinician and patient.

Using the proposed solution, the clinician can harness artificial intelligence and an intuitive interface to improve the process of cardiac diagnosis, reduce clinician time and improve patients outcomes.


